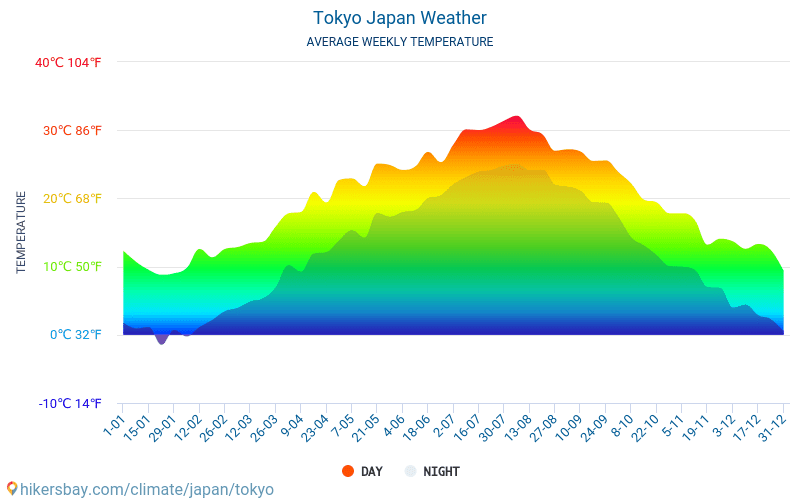
The table shows mean daily global solar radiation (important for solar electricity output) for Tokyo averaged of 30 years (1951-1990). The first graph shows average weekly temperatures in Tokyo.
We observe the natural agreement of high solar radiation and high temperatures from May to September. Therefore, high temperatures in Tokyo occur at times of high solar power output of solar panels.
| Stat. Descr. | Unit | Jan | Feb | Mar | Apr | May | Jun | Jul | Aug | Sep | Oct | Nov | Dec |
|---|
| Mean Daily Value | MJ/m2 | 8.5 | 9.9 | 11.7 | 14.3 | 16.0 | 13.6 | 13.9 | 14.6 | 10.4 | 9.4 | 7.6 | 7.4 |
Source: UNData of Global Solar Radiation for Tokyo, avg. 1961-1990
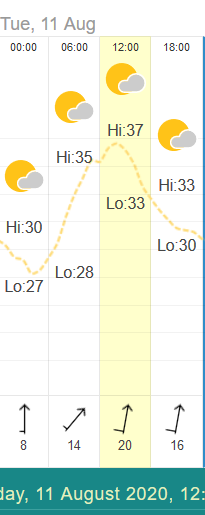
As an example the graph to the left shows the 24h temperature curve of 11th August 2020. The peak temperatures occur between approx. 9am and 6pm.
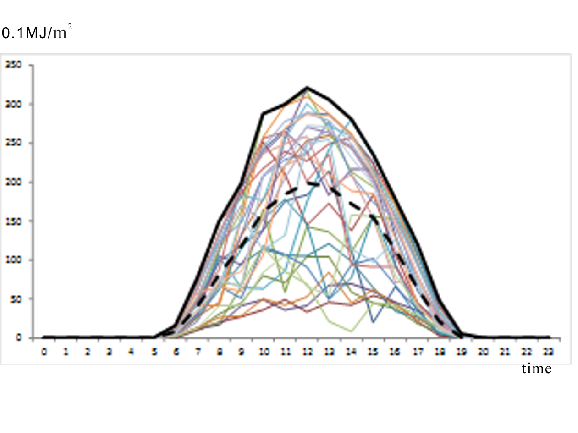
Comparison with the average 24 hour solar irradiance per hour (generates solar electricity) during a day in August shows, that it is maximal between 9am and 5pm.
This shows that even on the scale of hours, high temperatures and high solar irradiance (-> high solar electricity output) agree.
Solar rooftop electricity therefore does not need to be stored expensively, it can be immediately used for air conditioning when it is most needed.
O Lord, how manifold are Your works!
In wisdom You have made them all.